The Contacts Dashboard has five views, so you can drill down to precisely what analytics you are looking for.

General
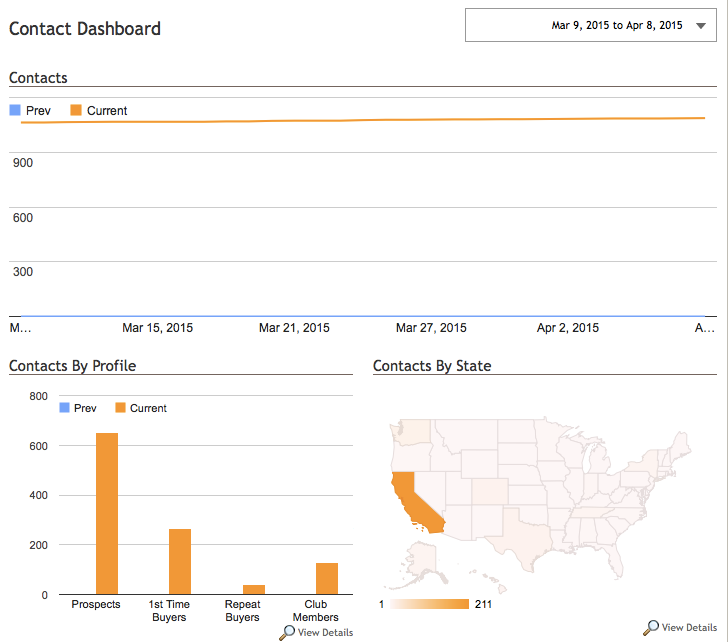
On the General area of the dashboard (this is the page you'll land on coming to the Contacts Dashboard), you'll find graphs to display your number of customers (aka contacts), contacts by profile, contacts by state, your contact's last login, as well as upcoming contact birthdays. You may click the spyglass icons that say View Details below the box for a more detailed view.
You may also use the date range area in the top right of the page to select the date range for the data at which you are viewing. You can also choose to compare date ranges for this data. When finished, click the Go button, and the page reloads new data.
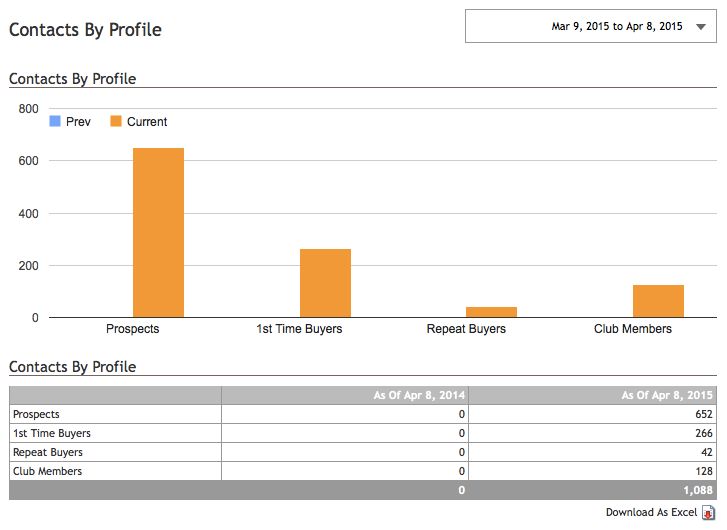
By Profile
In this area of the Contacts Dashboard, you can look through the data based on their buyer profile - prospects, 1st-time buyers, repeat buyers, and club members. The top area will show you a bar graph of contacts by shape through date and several references in that date range. You may change the date range by using the date range area in the top right of the page. The bottom site will give you a data table of solid numbers for each contact profile in the selected comparing date ranges. You may also download this data in an excel file by clicking the Download as Excel link at the bottom right of the page.
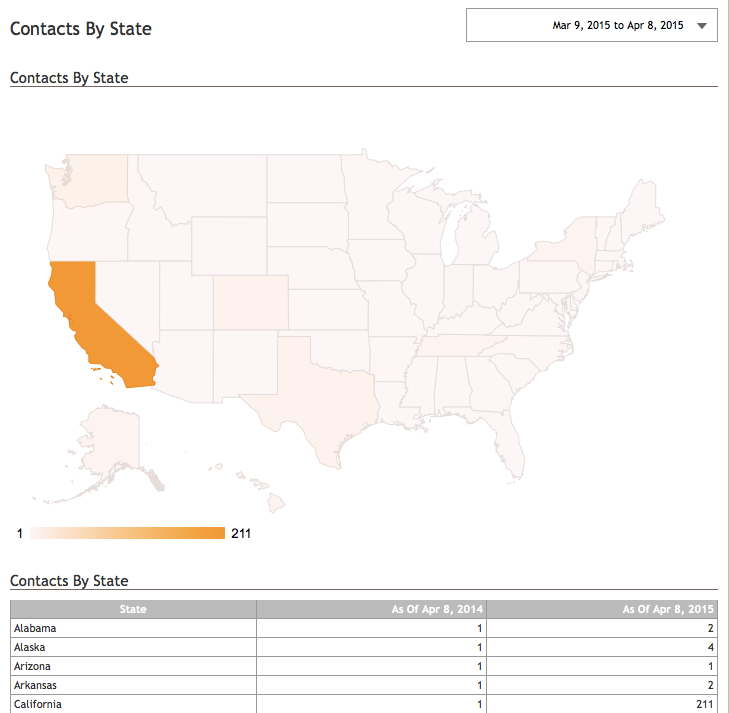
By State
In this area of the Contacts Dashboard, you can look through the data based on the state your contacts are from. The top spot of the page shows a map color-coded based on the number of members. If you hover your mouse over any given state, a box will pop up telling the exact number of contacts for the date range you have selected. The bottom area shows you in a data table the number of connections for each state for your selected date range (it's just another way of seeing the data without hovering on the map). You may also download this data in an excel file by clicking the Download as Excel link at the bottom right of the page.
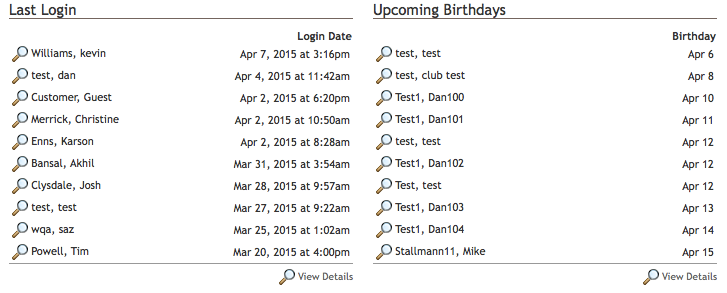
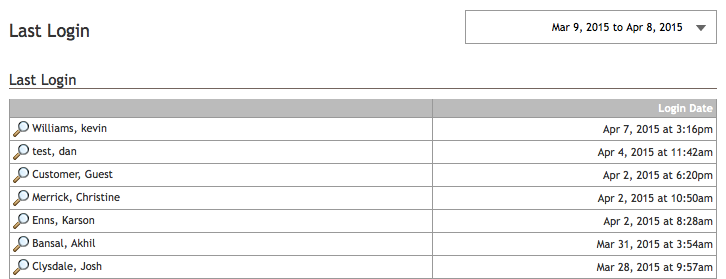
By Login
The contacts by last login area provide a data table listing your communications and their later login date on your selected range. Clicking on the spyglass to the left of any customer name will bring up their customer details. You may also download this data in an excel file by clicking the Download as Excel link at the bottom right of the page.
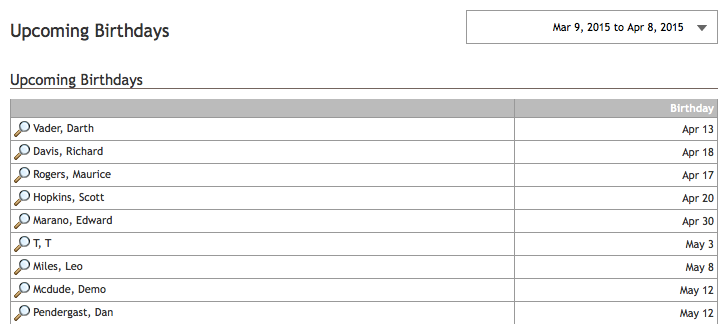
By Birthdate
In this area, you'll see how many people have upcoming birthdays in the selected date range. Clicking on the spyglass to the left of any customer name will bring up their customer details. You may also download this data in an excel file by clicking the Download as Excel link at the bottom right of the page.