The Sales tab in your Dashboard has five views: General, By Order Type, By Bill-To State, By Customer, By Product. You can view your sales analytics and drill down precisely on the analytics you are looking for by choosing one of them.

General
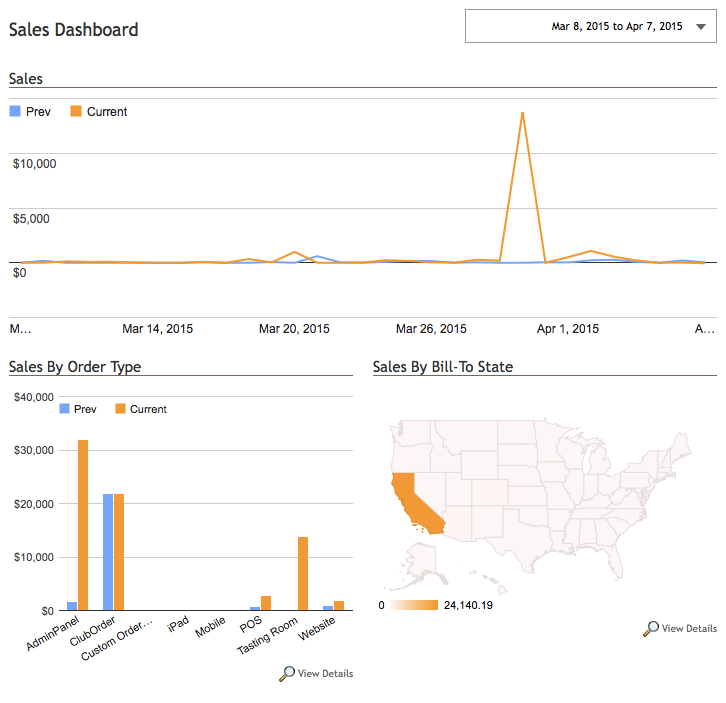
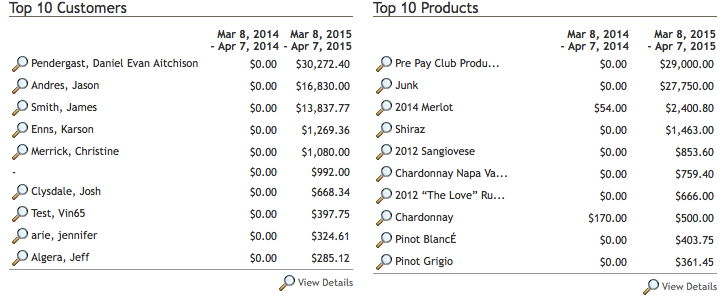
On the general area of the dashboard (this is the page you'll land on coming to the Sales Dashboard), you'll find graphs to display your total sales, sales by channel, sales by state, top 10 customers, and top 10 products. You may click the spyglass icons that say View Details below the box for a more detailed view.
You may also use the date range area in the top right of the page to select the date range for the data at which you are viewing. If you click on the arrow next to the date range in the box at the top right corner, you can select whether you see sales data for POS, Ecommerce, Admin Panel, or Club, or you can choose all. You can also like to compare date ranges for this data. When finished, click the Go button to reload the page with new data.
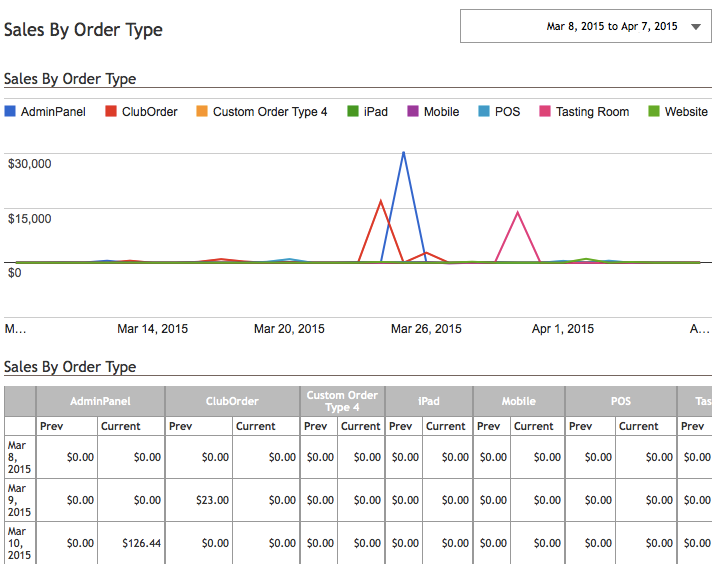
By Order Type
In this area of the Sales Dashboard, you can look through the data based on the channels of AdminPanel, ClubOrder, iPad, Mobile, POS, Tasting Room, Website, etc. The top area will show you a sales chart by the channel through date and sales in that date range. You may change the date range by using the date range selection in the top right of the page. The bottom area will give you a data table of solid numbers for each day in your date range based on the order type the sales have come through.
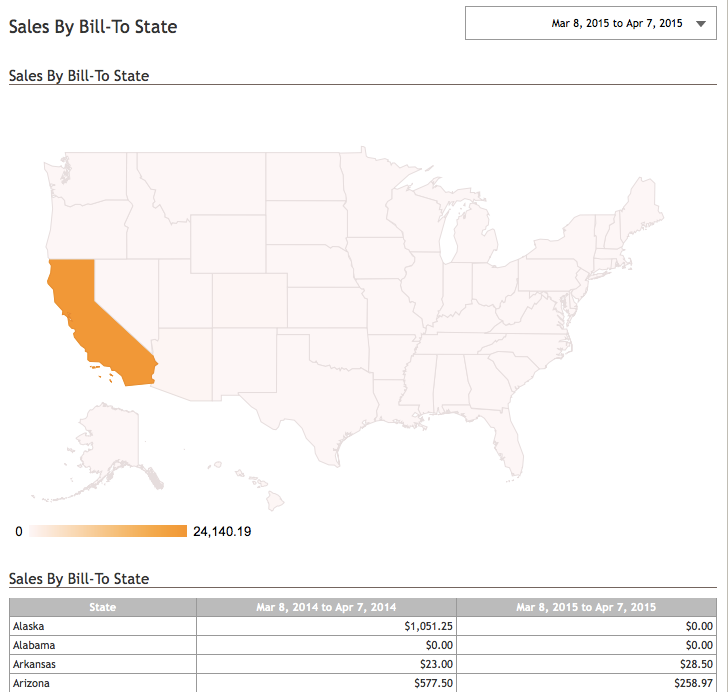
By Bill-To State
In this area of the Sales Dashboard, you can look through the data based on the state the sales took place. The top spot of the page shows a map color-coded based on the number of sales. If you hover your mouse over any given state, a box will pop up telling you the exact amount of sales for the date range you have selected. In a data table, the bottom area shows you the dollar sales for each state for your selected date range.
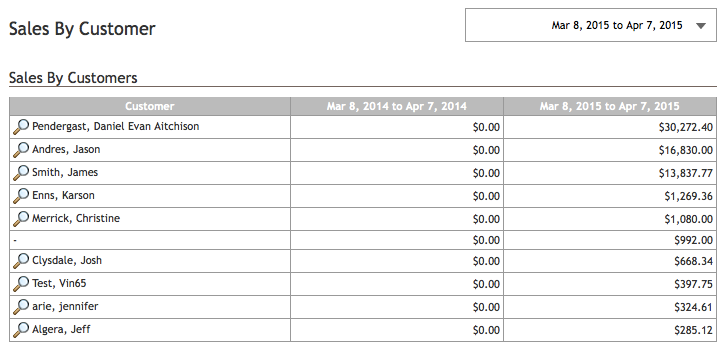
By Customer
Sales by the customer simply give you a data table listing your customers and the deals you have generated from them based on the date range you've selected. Clicking on the spyglass to the left of any customer name will bring up their customer details.
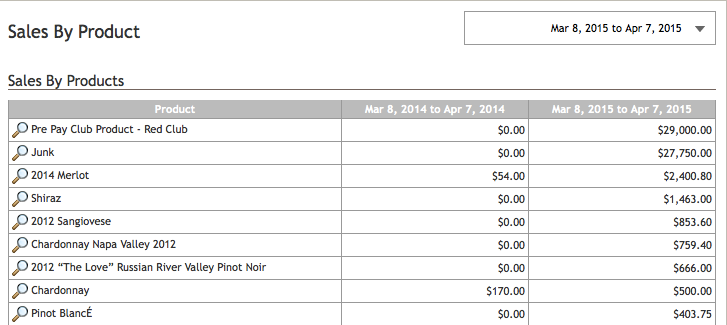
By Product
Sales by-product will be a data table listing your products and the sales generated from each based on your selected date range. Clicking the spyglass to the left of any given product will open up the details for that product.